http://weelookang.blogspot.sg/2011/05/workshop-on-learning-physics-of-sport.html
Briefing Document: Kinematics of a Falling Ball using Tracker Video Analysis
Source: "20110119 Lee T.L., Wee, L. K. (2011, 19 January) workshop on investigation of the kinematics of a falling ball through Video Analysis and Modeling , 3rd Instructional Program Support Group (IPSG) Physics, Anglo-Chinese Junior College, Singapore - Open Educational Resources / Open Source Physics @ Singapore"
Date: October 27, 2024
Purpose: This document provides a summary of a workshop focused on using video analysis to investigate the kinematics of a falling ball. The workshop utilized the free software Tracker to analyze motion and reinforce fundamental physics concepts.
Main Themes:
- Video Analysis as a Learning Tool: The primary focus of the workshop is to leverage video analysis as an engaging method for teaching and learning physics. Instead of relying solely on theoretical concepts or textbook examples, participants used real-world video footage of a falling ball. This approach allows for a more hands-on, experimental learning experience.
- Kinematics Exploration: The workshop aims to explore various concepts in kinematics, including speed, velocity, acceleration, and the relationship between these quantities. The motion of a falling ball serves as a practical example for visualizing and understanding these concepts.
- Free Software & Accessibility: The workshop promotes the use of freely available software, specifically Tracker, for video analysis. This emphasizes that such tools are accessible and encourages the use of technology in physics education without financial barriers. The workshop also notes the use of other free software like "Any Video Converter." The source highlights that "Tracker is free software; you can redistribute it and/or modify it under the terms of the GNU General Public License."
- Graphical Analysis: The workshop emphasizes graphical analysis of motion. Tracker allows users to plot various kinematic quantities (position, velocity, acceleration) over time. This enables participants to analyze the data visually, draw conclusions about the motion, and see relationships more clearly.
- Mathematical Modeling: Participants are guided to use Tracker to create mathematical models to represent the motion of the falling ball. Specifically, the worksheet directs users to "select 'Parabola' Fit Equation of the form y = at^2 + bt + c" and "Linear Fit Equation y = a*t + b" for position-time and velocity-time graphs respectively. This bridges the gap between experimental data and mathematical representation, demonstrating the predictive power of mathematical models.
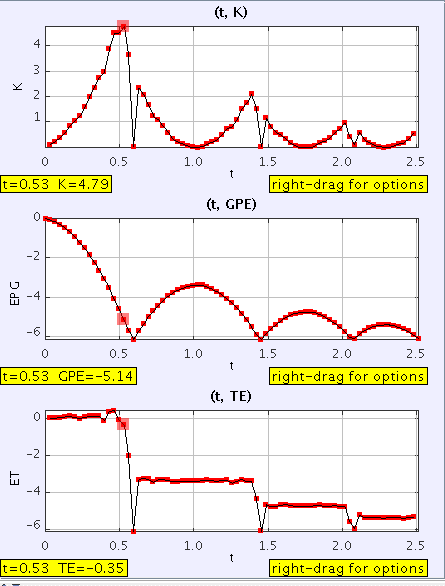
- Energy Considerations: The workshop expands beyond basic kinematics to explore energy concepts. Participants are guided to "Define potential energy, and total energy, via 'data builder'." This integrates energy concepts into the kinematic study of the falling ball.
Key Ideas & Facts:
- Software:
- Tracker: The primary software used for video analysis. It allows users to track the position of an object frame by frame and generate graphs of kinematic variables. The workshop provides a download link, and points to the help documents.
- Java: The software requires "Java 1.5jre-6u20-windows-i586.exe" to run.
- QuickTime: Quicktime 7 is also mentioned for video playback.
- Any Video Converter: Free software to convert videos is suggested.
- Workflow: The workshop provides a step-by-step procedure for using Tracker:
- Open the video clip in Tracker.
- Set the start and end frames for analysis.
- Set the reference frame and scale using the "Axes" and "Tape Measure" tools.
- Create a "Point Mass" to track the ball's motion.
- Track the ball's position in each frame by holding down shift and clicking. (Note: It's emphasized not to skip frames)
- Plot and analyze the tracks with the "Plots" button.
- Analyze y vs t, vy vs t and ay vs t plots with appropriate curve fits.
- Define potential and total energy with the "data builder".
- Data Analysis:
- Users are instructed to perform a curve fit (parabola) on the position-time graph and a linear fit on the velocity-time graph.
- Users are instructed to find the area under the curve for the velocity-time plot to learn more about displacement.
- The user is instructed to "take a look at the parameters and values" of the curve fit.
- Kinematic concepts: Concepts like speed, velocity, and acceleration are explored. The exercise helps to see the difference between displacement (area under velocity-time graph) and total distance (which cannot be found with the provided tool).
- Video Source: The video used was available at the link: http://www3.science.tamu.edu/cmse/videoanalysis/balldropbounce4x.avi
Quotes from the Source:
- "Aim : To investigate the kinematics of a falling ball"
- "Concepts in mechanics which include speed, velocity, acceleration, force, gravitational field and energy conversion and conservation are explored in this lesson."
- "Analysis of the motion of an object is performed using free-body and vector diagrams, graphical analysis as well as Mathematical formulas."
- "If tracking an object, mark its position on every frame by holding down the shift key and clicking the mouse (crosshair cursor) as the video automatically steps through the video clip. Note : don't skip frames--if you do, velocities and accelerations cannot be determined."
- "Select points you want to perform a curve fit. For this exercise, select “Parabola” Fit Equation of the form y = at^2 + bt + c"
- "Define potential energy, and total energy, via “data builder” (access through “Track Control”)."
Conclusion:
The workshop described in this document provides a detailed, hands-on approach to learning about kinematics through video analysis. It leverages free software, a clear set of instructions, and ties practical data analysis with core physics concepts and mathematical models. The document serves as a good example of how technology can be effectively integrated into physics education to create engaging and effective learning experiences. This approach is also extensible to learning about other areas of physics.
Lee T.L., Wee, L. K. (2011, 19 January) workshop on investigation of the kinematics of a falling ball through Video Analysis and Modeling , 3rd Instructional Program Support Group (IPSG) Physics, Anglo-Chinese Junior College, Singapore
recently Tat Leong email the worksheet
https://docs.google.com/document/pub?id=1Qj4XBLEDT4jd-BH9KI80Fk4A-DVz46NGzzFG0SGOGF0
video can be doanloaded here http://www3.science.tamu.edu/cmse/videoanalysis/balldropbounce4x.avi
http://www3.science.tamu.edu/cmse/videoanalysis/ by Joel A. Bryan
not sure why the embed code result in a small window
Workshop to investigate the kinematics of a falling ball , Anglo-Chinese Junior College, Singapore by Lee T.L., Wee, L. K. (2011, 19 January)
Workshop on Learning Physics of Sport Science through Video Analysis and Modeling, Anglo-Chinese Junior College, Singapore by Lee T.L., Wee, L. K. (2011, 19 January)
recently Tat Leong email the worksheet
https://docs.google.com/document/pub?id=1Qj4XBLEDT4jd-BH9KI80Fk4A-DVz46NGzzFG0SGOGF0
Background:
Procedure:
-
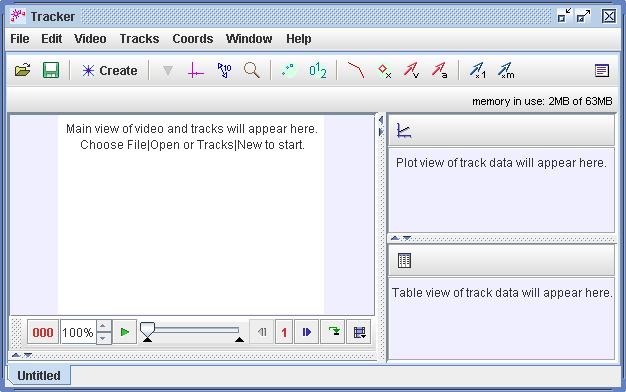
Click the Open button
-
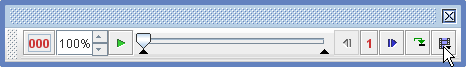
Select the display of the clip settings by clicking the clip settings button at the bottom right end of the player as shown.

-
Set the reference frame origin and angle. Click the Axes button .
-
To calibrate the scale on the video, click the Tape Measure button
-
The ball maybe difficult to detect due to the quality of the frames, select the Video–Filters-Deinterlace-Even and close it after selection. This step may increase the visibility of the ball.
-
If tracking an object, mark its position on every frame by holding down the shift key and clicking the mouse (crosshair cursor) as the video automatically steps through the video clip. Note: don't skip frames--if you do, velocities and accelerations cannot be determined. Track the ball until end of frame. Plot and analyze the tracks The Plot View displays graphs of track data. To plot multiple graphs, click the Plots button and select the desired (3) plots number. Click the x- or y-axis label to change the variable plotted on that axis. In this video, choose y versus t, vy versus t & ay versus t.
-
Right-click on a plot (y versus t) to access display and analysis options in a popup menu. Select the various options as shown in the figure.
-
Select points you want to perform a curve fit. For this exercise,
-
select “Parabola” Fit Equation of the form y = a*t^2 + b*t + c,
-
select “Autofit”,
-
take a look at the parameters and values
-
-
Repeat Steps 9 to 11 for plot (vy versus t) and use the “Linear” Fit Equation y = a*t + b
-
Right click on the plot of vy versus t and select Analyze-Area and select by click and drag the 2 grey vertical boundaries to select the area to measure for the duration of start of motion to the start of 1st bound of the ball. Calculate the area under a velocity-time graph.
Drag the grey lines
-
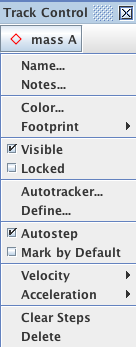
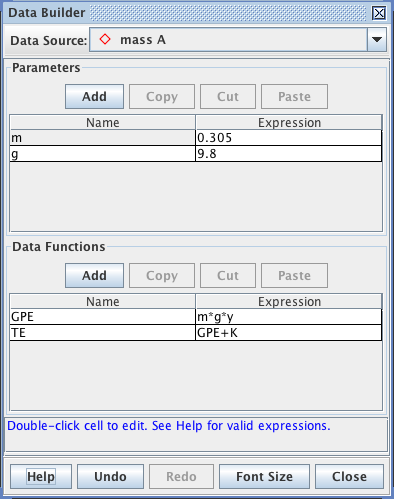
Define potential energy, and total energy, via “data builder” (access through “Track Control”).
* * *

 * * |
 * * |
 * * |
FAQ: Video Analysis of a Falling Ball with Tracker Software
- What is the purpose of the video analysis workshop described in the document?
- This workshop aims to teach participants how to investigate the kinematics of a falling ball using video analysis and modeling techniques. It specifically utilizes the free software called "Tracker" to analyze the motion captured in a video, allowing for a deeper understanding of physics concepts such as speed, velocity, acceleration, and energy transformations.
- What software is used in this workshop and why?
- The workshop uses Tracker, a free video analysis software, as the primary tool. Tracker allows users to import video clips, calibrate the scale, track the position of objects over time, and plot various kinematic variables like position, velocity, and acceleration. This makes it ideal for visually analyzing motion in a way that is difficult to do with traditional methods.
- How does Tracker help in understanding kinematics?
- Tracker enables a visual and interactive approach to understanding kinematics. By tracking the position of a falling ball frame by frame, users can visualize the ball's trajectory and then generate plots of position vs. time, velocity vs. time, and acceleration vs. time. These graphs allow participants to directly observe and quantify the relationships between kinematic variables, for instance, how a constant acceleration affects velocity and position, and measure the acceleration due to gravity.
- What is the process for analyzing a video of a falling ball in Tracker?
- The process involves several key steps: first, the user imports a video and sets the start and end frames for analysis. Then, a reference frame is established and calibrated using a known distance in the video. Next, the position of the ball is tracked frame-by-frame, with the use of a deinterlace filter to improve the video quality if needed. Finally, the tracked data is used to generate graphs, which can be analyzed for kinematic variables and curve fitting, such as a parabola for position-time graph or a line for velocity-time graph.
- What kind of data can be extracted from the analysis using Tracker?
Using Tracker, you can extract detailed data including the ball's position in both x and y direction at each frame, from which it calculates the instantaneous velocity (vx and vy) and the acceleration (ax and ay). The tool is used to examine the change in position and the change in velocity in the y-direction for the falling ball. Additionally, Tracker is able to measure the area under the velocity time graph to calculate the displacement of the falling ball. Finally users can add data that can be used to examine potential energy, kinetic energy and total energy.
- How can you calculate the acceleration due to gravity using the Tracker analysis?
The acceleration due to gravity is extracted from the slope of the velocity time graph (vy vs. time) graph. After using Tracker to track a ball, a linear fit is applied to the vy vs t graph which will provide the slope of the linear line. This slope corresponds to the average acceleration of the ball, and if air resistance is negligible, it corresponds to acceleration due to gravity, which in this activity is in the vertical or y direction.
- Beyond kinematics, what other physics concepts can be explored using Tracker in this context?
While the focus of the workshop is on kinematics, Tracker can also be used to examine energy transformations. By defining and analyzing the potential and kinetic energies of the falling ball, you can visualize the conservation of mechanical energy, and analyze how potential energy gets converted to kinetic energy, and if applicable, the reverse.
- What additional resources are provided to support the learning process?
- The workshop materials include links to a sample video for analysis, a worksheet (Google Doc) that guides participants through the steps of the Tracker software, and links to tutorial videos on YouTube. Furthermore, there's also a link to a comprehensive help document that provides a deeper understanding of the software. These resources ensure a supported, effective and accessible learning experience for all the participants.